
View Statistical Table/Graph
| Statistics name | Housing and Land Survey 2023 Housing and Land Survey Land Tabulation | |
|---|---|---|
| Table number | 236-1 | |
| Table title | Principal Households by Age of Main Earner (14 Groups) and Tenure State of Lands Other than Site of Present Dwelling (4 Groups) - Japan |
| Dataset overview | ||
|---|---|---|
| Statistics name | Housing and Land Survey | Detail |
| Dataset category0 | 2023 Housing and Land Survey | |
| Dataset category1 | Land Tabulation | |
| Table category1 | Tenure State of Lands Other than Site of Present Dwelling | |
| Published date and time | 2025-03-26 14:00 |
Show more
- Select display item
- Table Layout
- Set graph display
Select display item
All items will be displayed initially. please follow the procedures below to change it.
- Press Select Item to set the items.
- When pressing proceed button, changed content will be updated and displayed.
Number of screen display cells:
Total screen cell count:
(A table is able to display 100,000 cells at a maximum.
A Graph is able to display 15,000 cells at a maximum.)
A Graph is able to display 15,000 cells at a maximum.)
description
| SN | Table element | Description | |||
|---|---|---|---|---|---|
| 1/5 |
Tabulated variable
|
1/1 | |||
| 2/5 |
Age of main earner
|
15/15 | |||
| 3/5 |
Owning dwellings other than present land
|
6/6 | |||
| 4/5 |
Japan
|
1/1 | |||
| 5/5 |
Time
|
1/1 | |||
Table Layout
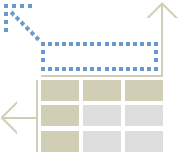
To change the layout, press the following item names and select "Top of Page" "Column" "Row" to move the items.
To change the order of display, press to adjust it.
To save and display the changes, press Set and refresh .
1
Table Layout
Top of page (margin)
Top of page (margin)
Column
Row
Tabulated variable
Top of page (margin)
Column
Row
Age of main earner
Top of page (margin)
Column
Row
Owning dwellings other than present land
Top of page (margin)
Column
Row
Japan
Top of page (margin)
Column
Row
Time
Column
Row
Number of screen display cells:
Total screen cell count:
(A table is able to display 100,000 cells at a maximum.
A Graph is able to display 15,000 cells at a maximum.)
A Graph is able to display 15,000 cells at a maximum.)
「」outline
| Statistics name | |
|---|---|
| URL | |
| Ministry (Division) in charge | |
| E-mail address | |
| Phone number |
- For details of each statistical survey, please refer to the homepage above.
- Information on relevant government statistics such as "Survey outline", "Survey results", "Attention on use", "Release schedule", and "Contact" are posted on the website of each ministry. Please use it before using the statistical tables.
Set display items
Set items to be displayed or hidden.
Display switch
Select: ---
All items: ---
Unselected: ---
Select all
Clear all
Principal Households
Total
Under 25 years old
25 to 29 years old
30 to 34 years old
35 to 39 years old
40 to 44 years old
45 to 49 years old
50 to 54 years old
55 to 59 years old
60 to 64 years old
65 to 69 years old
70 to 74 years old
75 to 79 years old
80 to 84 years old
85 years old and over
Total
Owning additional land
Dwelling, etc. (excluding farmland and/or mountain/forest)
Farmland
Mountain/forest
Not owning
Japan
2023
* When selecting multiple items, hold down the Ctrl key while selecting.
If it is a continuous range, move the mouse while holding down the left mouse click? Please select while holding down the Shift key.
If it is a continuous range, move the mouse while holding down the left mouse click? Please select while holding down the Shift key.
Swap selected items
Reverse
Selected items select /clear
Select
Clear
Select subordinate group
Select
Clear
Select in the same hierarchy
Select
Clear
Select in the time range
Legend
| *** | The one that figure is not obtained |
|---|---|
| - | |
| ... | |
| X |
the selected characters will be displayed instead
of the characters in the legend display.
Download graphs
Options
| File type |
|---|
Estimated size list
| PNG | ...KB |
|---|
ヘルプ
Processing...