- Select region
- Select display item
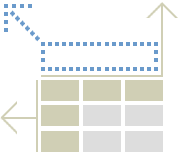
- Table Layout
- Set graph display
Select region
- Any Regions
- Similar Regions
1
Filter
1
Similar region search source
| Display data | ||
|---|---|---|
| Region classification | ||
| Filter | ||
| Similar region search source |
|---|
2
Region candidate
2
Search condition
Search condition1
| (No search condition set) | to | |
Search condition2
| (No search condition set) | to | |
Search condition3
| (No search condition set) | to | |
Search condition4
| (No search condition set) | to | |
Search condition5
| (No search condition set) | to | |
Search condition6
| (No search condition set) | to | |
Search condition7
| (No search condition set) | to | |
Search condition8
| (No search condition set) | to | |
Search condition9
| (No search condition set) | to | |
Search condition10
| (No search condition set) | to |
| Remaining 9 item(s) can be selected. |
3
Regional range
4
Region candidate
Table Layout
1
Table Layout
Top of page (margin)
Top of page (margin)
Column
Row
Item
Top of page (margin)
Column
Row
Area
Top of page (margin)
Column
Row
Survey year
Column
Row

Number of screen display cells:
Total screen cell count:
(A table is able to display 100,000 cells at a maximum.
A Graph is able to display 15,000 cells at a maximum.)
A Graph is able to display 15,000 cells at a maximum.)
2
Display year
Legend
| *** | Not surveyed or aggregated |
|---|---|
| - | Not available |
| X | Figures kept undisclosed |
the selected characters will be displayed instead
of the characters in the legend display.
| ... | ... | |
| ... | ... |
| No. |
|---|
Download graphs
Options
| File type |
|---|
Estimated size list
| PNG | ...KB |
|---|
ヘルプ
Processing...

 Notes
Notes