
 Notes
Notes
- Select region
- Select display item
- Table Layout
- Set graph display
Select region
- Any Regions
- Similar Regions
1
Filter
1
Similar region search source
| Region classification | About the district |
|---|
| Similar region search source |
|---|
2
Region candidate
2
Search condition
Search condition1
| (No search condition set) | to | |
Search condition2
| (No search condition set) | to | |
Search condition3
| (No search condition set) | to | |
Search condition4
| (No search condition set) | to | |
Search condition5
| (No search condition set) | to | |
Search condition6
| (No search condition set) | to | |
Search condition7
| (No search condition set) | to | |
Search condition8
| (No search condition set) | to | |
Search condition9
| (No search condition set) | to | |
Search condition10
| (No search condition set) | to |
| Remaining 9 item(s) can be selected. |
3
Region candidate
description of "district"
The number shown in "District" is simply the sum of all the prefectures belonging to each district.
The items that can be aggregated can be selected.
The items that can be aggregated can be selected.
TypeⅠThe typeⅠ explanation
| Hokkaido | Hokkaido |
|---|---|
| Tohoku | Aomori-ken Iwate-ken Miyagi-ken Akita-ken Yamagata-ken Fukushima-ken |
| Kanto | Ibaraki-ken Tochigi-ken Gumma-ken Saitama-ken Chiba-ken Tokyo-to Kanagawa-ken Yamanashi-ken Nagano-ken |
| Hokuriku | Niigata-ken Toyama-ken Ishikawa-ken Fukui-ken |
| Tokai | Shizuoka-ken Gifu-ken Aichi-ken Mie-ken |
| Kinki | Shiga-ken Kyoto-fu Osaka-fu Hyogo-ken Nara-ken Wakayama-ken |
| Chugoku | Tottori-ken Shimane-ken Okayama-ken Hiroshima-ken Yamaguchi-ken |
| Shikoku | Tokushima-ken Kagawa-ken Ehime-ken Kochi-ken |
| Kyushu | Fukuoka-ken Saga-ken Nagasaki-ken Kumamoto-ken Oita-ken Miyazaki-ken Kagoshima-ken |
| Okinawa | Okinawa-ken |
TypeⅡThe typeⅡ explanation
| Hokkaido | Hokkaido |
|---|---|
| Tohoku | Aomori-ken Iwate-ken Miyagi-ken Akita-ken Yamagata-ken Fukushima-ken |
| Kanto | Ibaraki-ken Tochigi-ken Gumma-ken Saitama-ken Chiba-ken Tokyo-to Kanagawa-ken Niigata-ken Yamanashi-ken Nagano-ken Shizuoka-ken |
| Chubu | Toyama-ken Ishikawa-ken Gifu-ken Aichi-ken Mie-ken |
| Kinki | Fukui-ken Shiga-ken Kyoto-fu Osaka-fu Hyogo-ken Nara-ken Wakayama-ken |
| Chugoku | Tottori-ken Shimane-ken Okayama-ken Hiroshima-ken Yamaguchi-ken |
| Shikoku | Tokushima-ken Kagawa-ken Ehime-ken Kochi-ken |
| Kyushu | Fukuoka-ken Saga-ken Nagasaki-ken Kumamoto-ken Oita-ken Miyazaki-ken Kagoshima-ken |
| Okinawa | Okinawa-ken |
TypeⅢThe typeⅢ explanation
| Hokkaido | Hokkaido |
|---|---|
| Tohoku | Aomori-ken Iwate-ken Miyagi-ken Akita-ken Yamagata-ken Fukushima-ken |
| Kanto | Ibaraki-ken Tochigi-ken Gumma-ken Saitama-ken Niigata-ken Nagano-ken |
| Tokyo | Chiba-ken Tokyo-to Kanagawa-ken Yamanashi-ken |
| Hokuriku | Toyama-ken Ishikawa-ken Fukui-ken |
| Chubu | Shizuoka-ken Gifu-ken Aichi-ken Mie-ken |
| Kinki | Shiga-ken Kyoto-fu Osaka-fu Hyogo-ken Nara-ken Wakayama-ken |
| Chugoku | Tottori-ken Shimane-ken Okayama-ken Hiroshima-ken Yamaguchi-ken |
| Shikoku | Tokushima-ken Kagawa-ken Ehime-ken Kochi-ken |
| KyushuⅠ | Fukuoka-ken Saga-ken Nagasaki-ken |
| KyushuⅡ | Kumamoto-ken Oita-ken Miyazaki-ken Kagoshima-ken |
| Okinawa | Okinawa-ken |
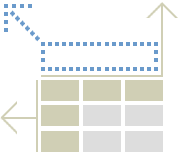
Table Layout
1
Table Layout
Top of page (margin)
Top of page (margin)
Column
Row
Item
Top of page (margin)
Column
Row
Area
Top of page (margin)
Column
Row
Survey year
Column
Row
Number of screen display cells:
Total screen cell count:
(A table is able to display 100,000 cells at a maximum.
A Graph is able to display 15,000 cells at a maximum.)
A Graph is able to display 15,000 cells at a maximum.)
2
Display year
Legend
| *** | Not surveyed or aggregated |
|---|---|
| - | Not available |
| X | Figures kept undisclosed |
the selected characters will be displayed instead
of the characters in the legend display.
| ... | ... | |
| ... | ... |
| No. |
|---|
Download graphs
Options
| File type |
|---|
Estimated size list
| PNG | ...KB |
|---|
ヘルプ
Processing...